


 109 / 164

105
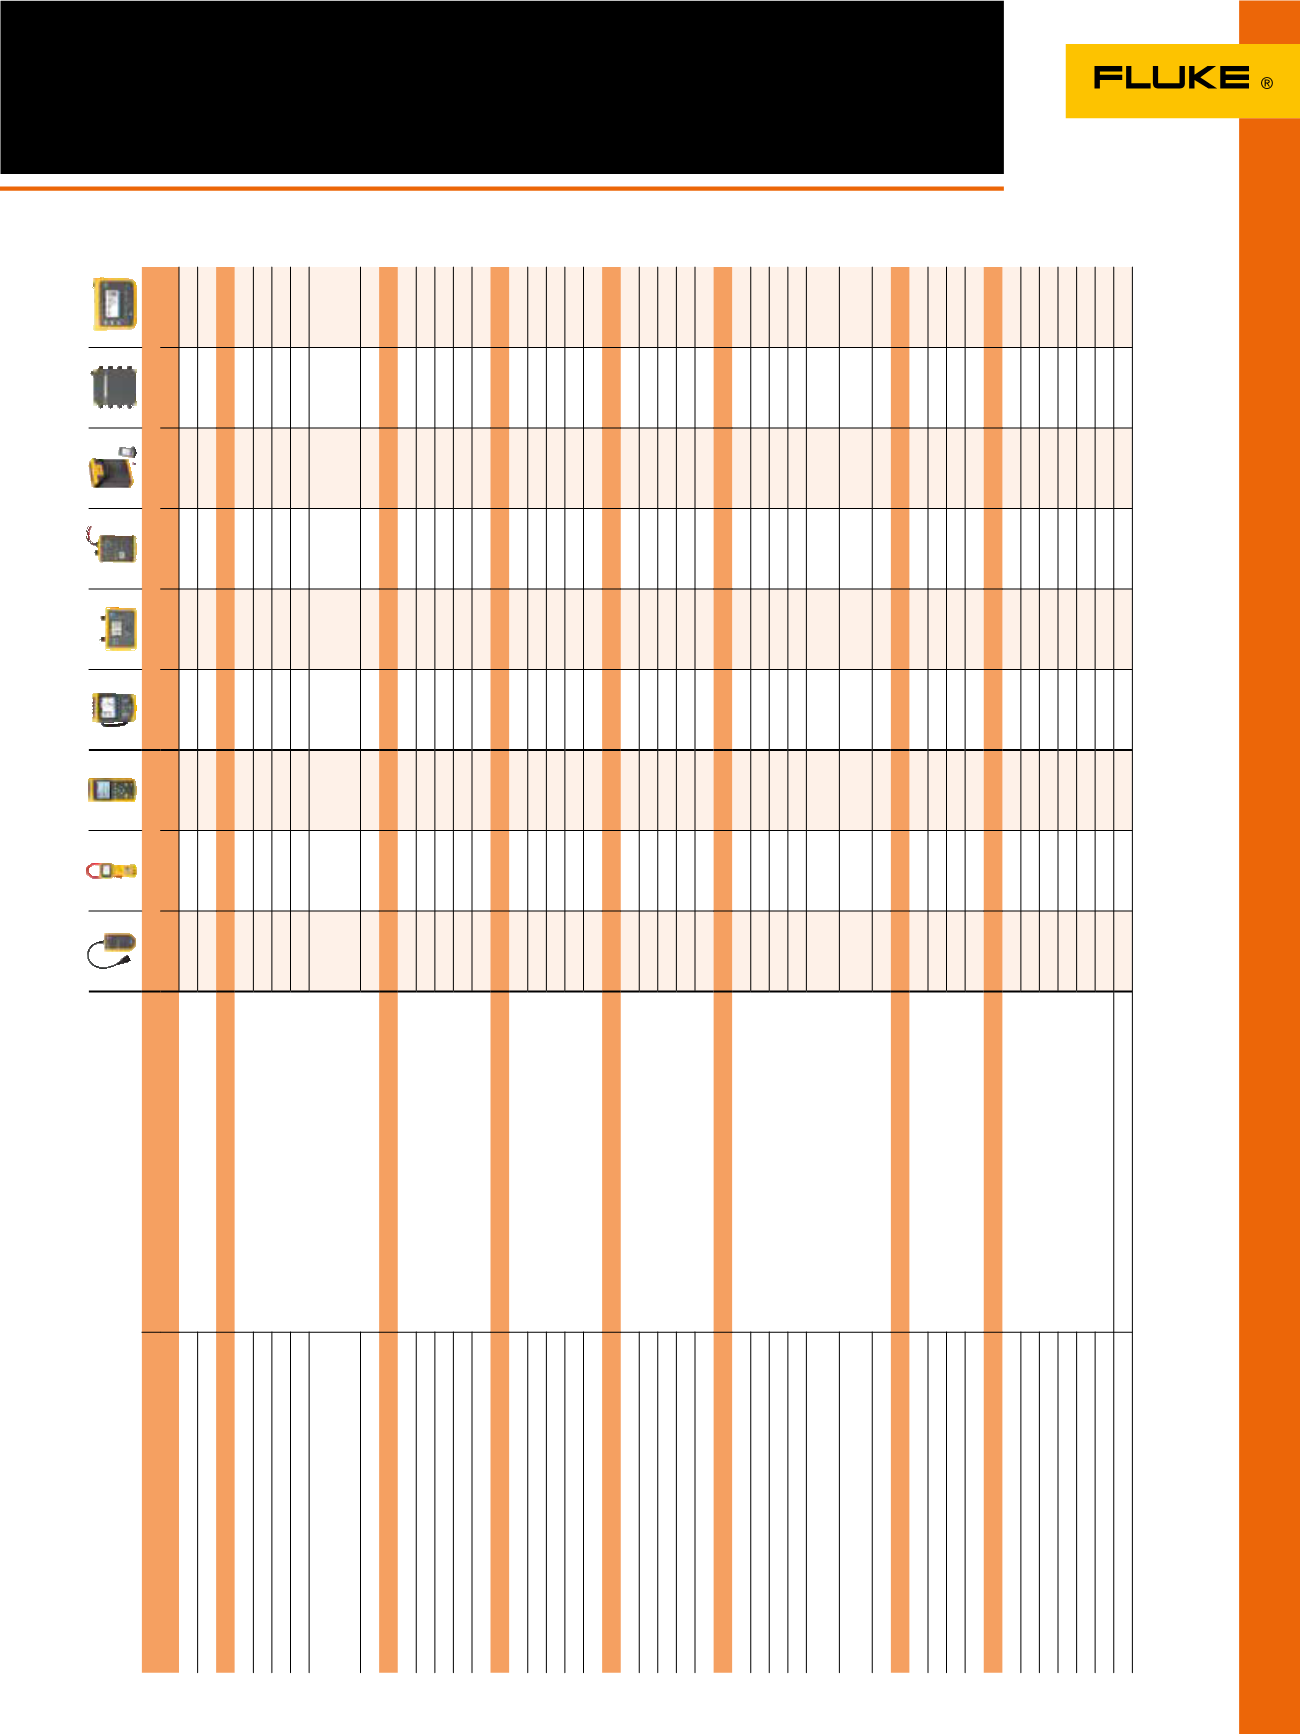
Power Quality Selection Guide
Power quality tools help pinpoint problems fast
Basic measurements
Application use
Single phase
Three phase
VR1710
345
43B
430 II
1735
1740
1750
1760
1730
RMS voltage
Detailed RMS trending shows how connected loads
behave.
●
●
●
●
●
●
●
●
●
RMS Current
●
●
●
●
●
●
●
●
Energy studies
Measure V, I, kW, Cos
ɸ
/DPF, kWh
Get detailed power and energy consumption
profiles during energy audits and pinpoint savings
opportunities.
●
●
●
●
●
●
●
●
Measure MIN/MAX and AVG values
●
●
●
●
●
●
●
●
10 day logging
●
●
●
●
●
●
●
●
Energy aggregation
●
●
●
●
●
●
Power (Eff. kW, Reactive kVAR, Unbalance kVAR,
Distortion kVAR, Neutral kVAR)
●
●
●
●
●
●
●
Energy loss calculator
●
Basic harmonics study
THD measurement (V & I)
Discover the source of distortion in your installation, so
that you can filter those loads or move them to separate
circuits.
●
●
●
●
●
●
●
●
●
Harmonics 1 to 25 for V & I
●
●
●
●
● ●
(not 1743)
●
●
Tabular values
●
●
●
●
●
Neutral current measurement
●
●
●
●
●
Crest factor
●
●
●
●
●
●
Advanced harmonics study
Full harmonic spectrum
If distorting loads are causing problems in your
installation, you need comprehensive data to intentify
the source and create a solution.
●
●
●
●
●
●
●
Power harmonics
●
●
●
●
●
Harmonics 1 to 50 and dc
●
●
●
●
(no DC)
(not1743)
●
●
k-factor
●
●
●
●
%Fundamental and %RMS
●
●
●
●
●
●
Basic Industrial PQ Troubleshooting
Oscilloscope function
When troubleshooting in the field, graphical data
enables you to trace the source of the problem at hand.
●
●
●
●
●
●
Voltage dips and swells
●
●
●
●
●
●
●
Phasor diagram
●
●
●
Trend recording
●
●
●
●
●
●
●
Inrush current
●
●
●
●
Advanced industrial PQ troubleshooting
Comprehensive logging capability
Complex installations often require a deeper dive into
measurement data. Multiple loads may be interacting
randomly to cause a single problem.
●
●
●
●
●
●
●
●
Transient capture
●
●
●
●
●
Flicker
●
●
●
●
●
EN50160 analysis
●
●
●
●
Complex System interaction event capture (manual
threshold setting)
●
Random/variable system event capture (Adaptive
threshold setting)
●
400 Hz
●
(only 437-II)
Utility PQ benchmarking
Phase sequence components
Before you install sensitive loads, make sure you
understand the existing quality of power delivered by
your utility. Comparing benchmarks over time can help
pinpoint potential areas of concern.
●
●
●
Interharmonics
●
●
●
●
Mains signaling
●
●
●
●
IEC61000-4-30 Class A
●
●
Software
Power Log
To make use of the power data you collect, you need
software that can help analyze your findings and share
them with equipment providers and plant management.
●
●
●
●
PQ Log
●
Power Analyze
●
PQ Analyze
●
FlukeView Power Quality
●
SD card (max 32 GB)
8 GB
8 GB
Fluke Energy Analysis
●